Intro
Every business has data, but not every business has clarity. I specialize in bridging that gap by transforming complex datasets into clear, actionable insights. With expertise in SQL, Excel, Power BI, and Python, I design interactive dashboards, uncover hidden trends, and provide recommendations that help businesses improve efficiency, optimize strategies, and drive growth.
Beyond technical skills, I bring a problem-solving mindset and the ability to communicate findings in a way that decision-makers can act on. Whether it’s analyzing healthcare operations, retail performance, or digital campaigns, my goal is simple: to turn data into decisions that make a measurable impact.
Healthcare Analysis: Readmission & Efficiency
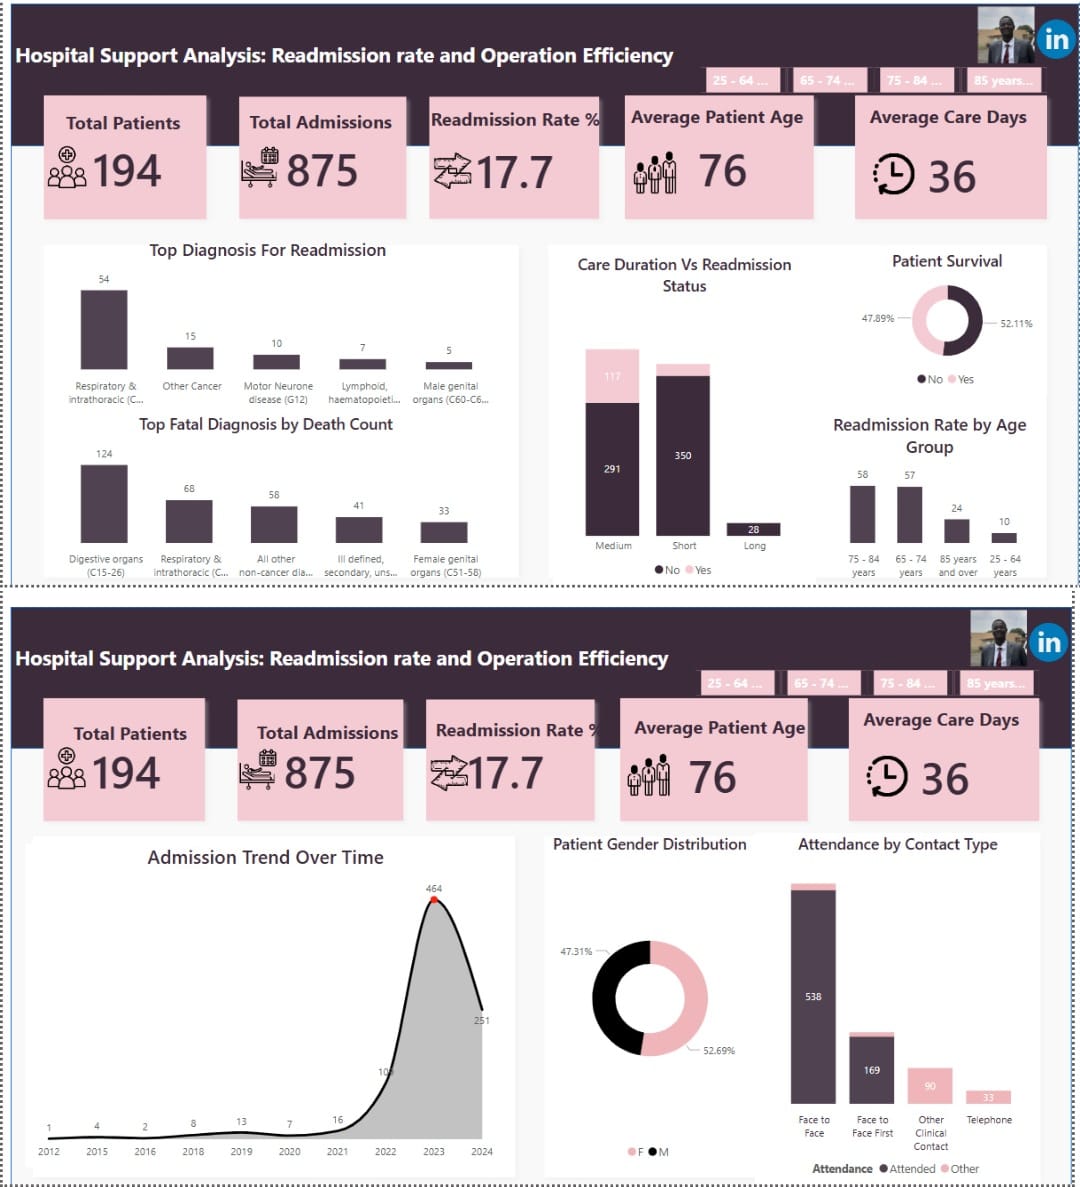
I analyzed hospital admissions data to uncover patterns in patient readmissions and identify ways to improve healthcare efficiency. Using Excel for preprocessing and Power BI for dashboards, I explored patient demographics, diagnosis-specific trends, care durations, and survival rates across community health, hospital support, and daycare services.
Key findings revealed that elderly patients (65+ years) and cancer-related diagnoses were the main drivers of readmissions and mortality. Shorter care durations often led to premature discharges, while underutilized telehealth limited scalability of patient monitoring.
The project provided data-driven recommendations to reduce readmissions, scale telehealth services, and improve discharge planning. These insights can guide resource allocation, healthcare planning, and policy support.
View full project on GitHub
Digital Marketing Campaign Analysis
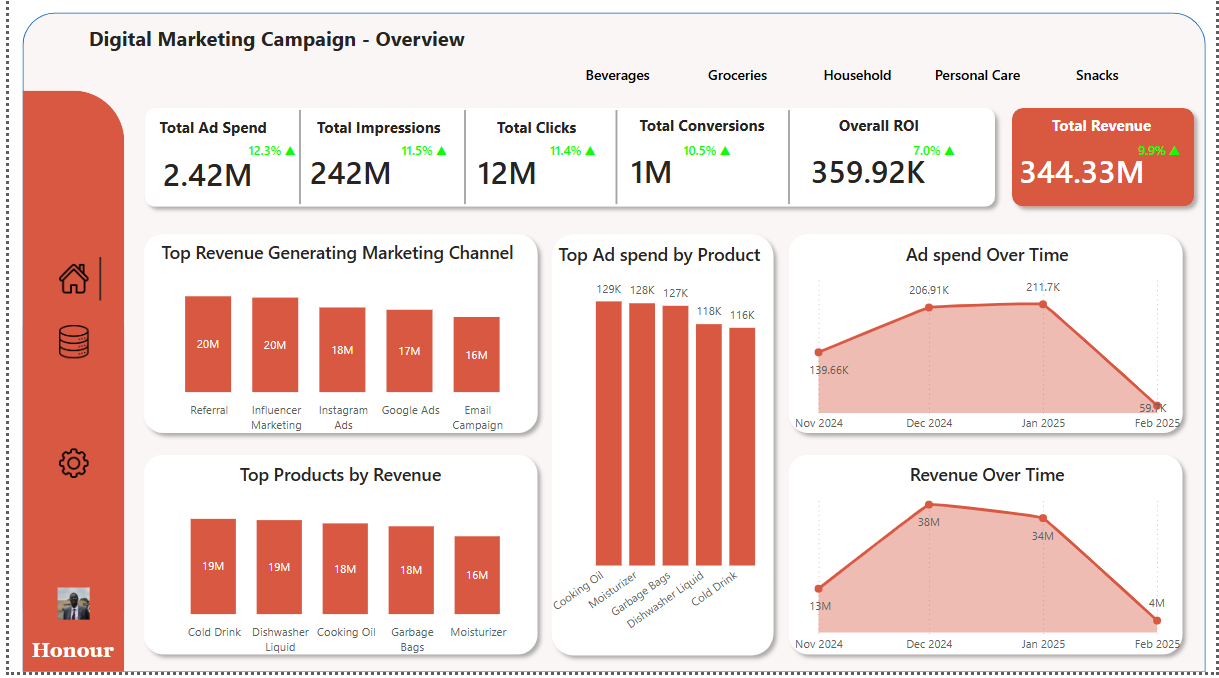
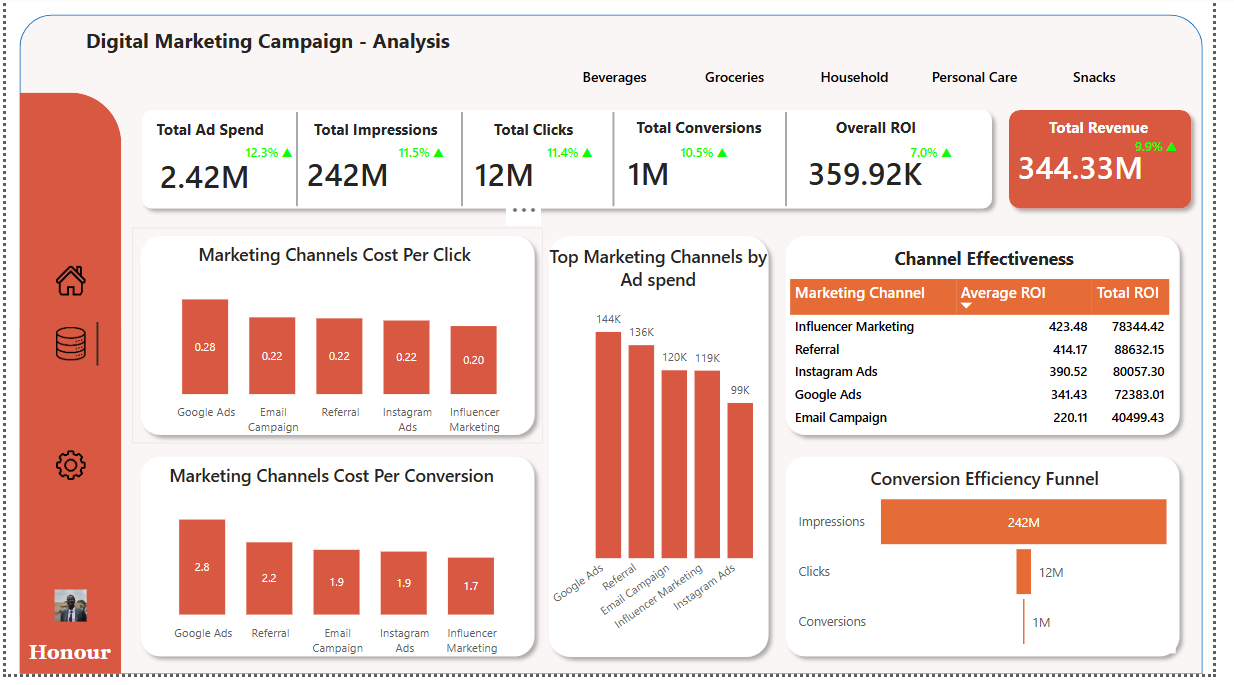
I analyzed multi-channel digital marketing campaigns to evaluate ad spend efficiency, ROI, and conversion performance. Using Excel for preprocessing (Data Cleaning) and Power BI for data modeling and dashboards, I explored campaign performance across products, channels, and time periods.
Key insights revealed that Influencer and Instagram Ads delivered the best ROI and lowest cost per conversion, while Google Ads showed high spend but lower efficiency. Revenue trends highlighted strong seasonality, with December–January peaks, and a clear correlation between consistent ad spend and revenue growth.
Recommendations focused on reallocating budgets toward high-performing channels, optimizing Google Ads with A/B testing, improving conversion funnels, and leveraging seasonality to maximize ROI.
View full project on GitHub
Pizza Sales Analysis
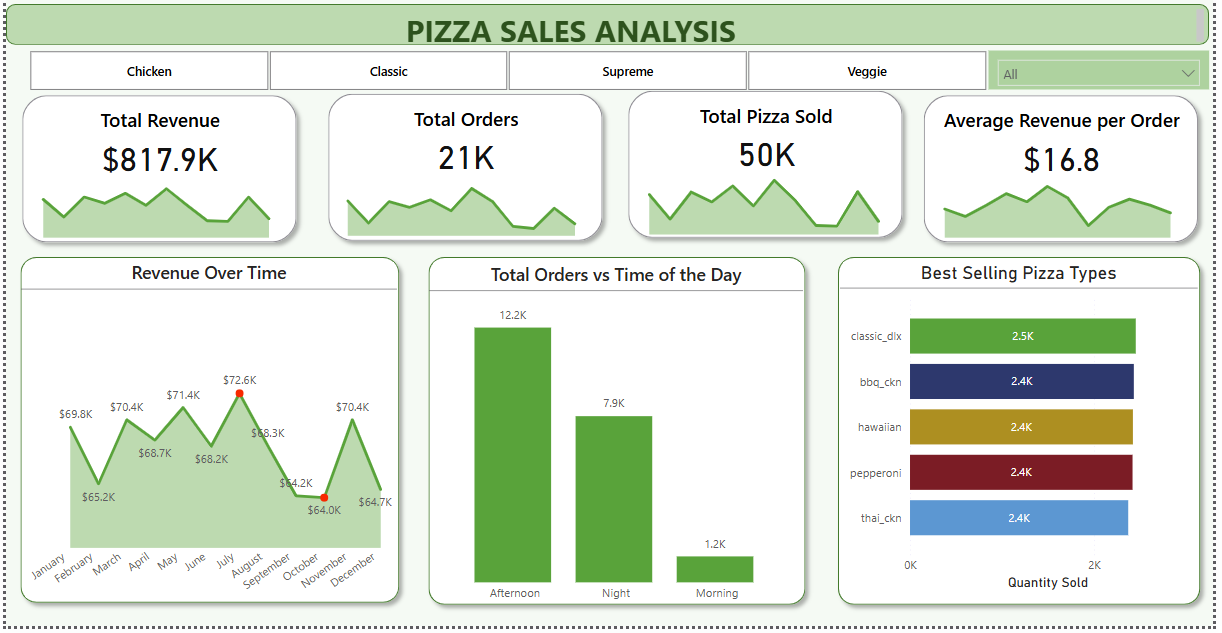
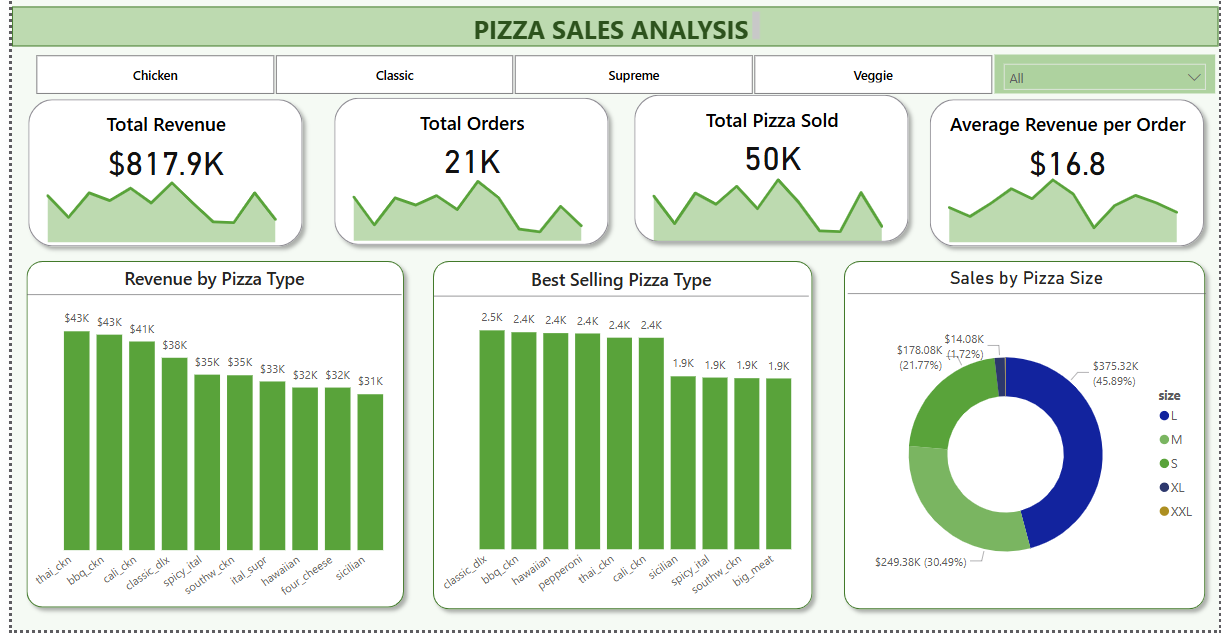
I designed a Power BI dashboard to analyze pizza sales performance across time, product type, and size. The project used Excel/CSV preprocessing, Power Query, and DAX for modeling, resulting in interactive visualizations that reveal sales patterns and revenue drivers.
Key insights showed that Classic Deluxe was the top-selling pizza, while Thai Chicken and BBQ Chicken generated the highest revenue. Large-sized pizzas contributed nearly 46% of total revenue, with peak sales occurring in the afternoon. However, high-order pizzas like Pepperoni and Hawaiian underperformed in revenue, highlighting pricing or size-related issues.
Recommendations included revising pricing strategies, upselling larger sizes through promotions, boosting marketing for top revenue pizzas, and targeting morning sales with discounts. These strategies aim to maximize revenue, balance product performance, and improve overall sales efficiency.
View full project on GitHub
Layoff Trends Analysis (SQL)
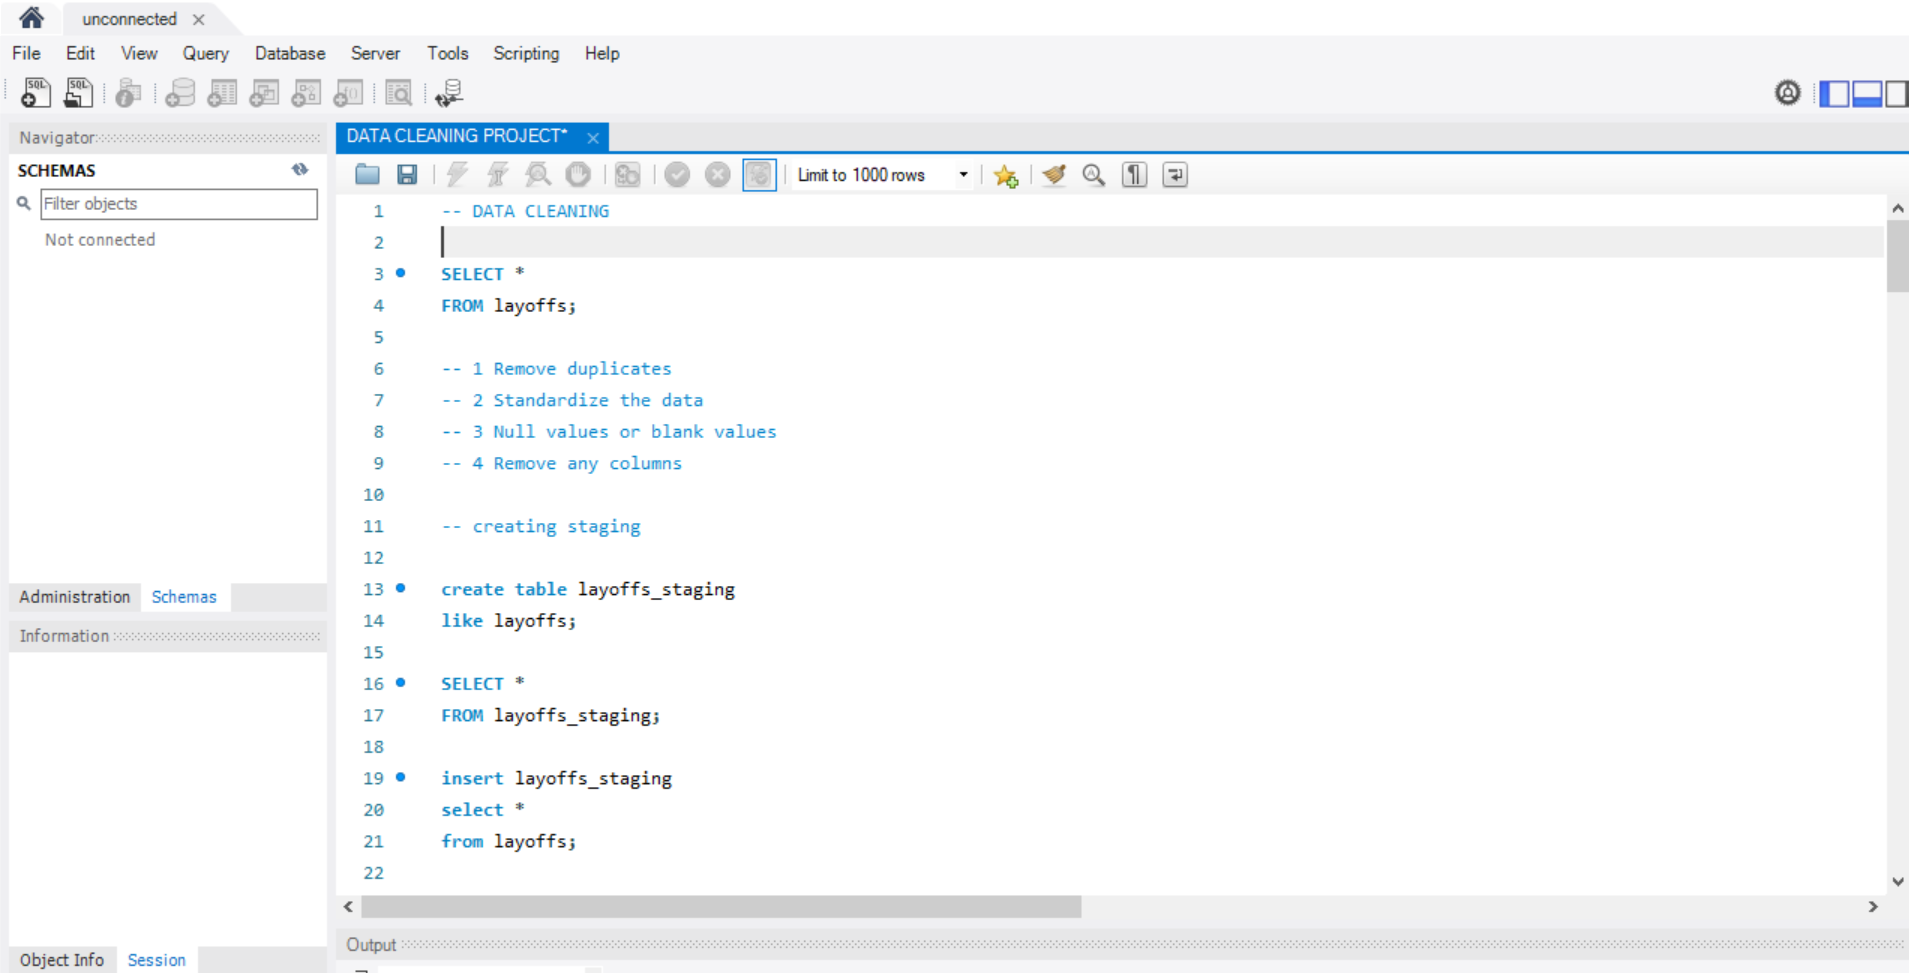
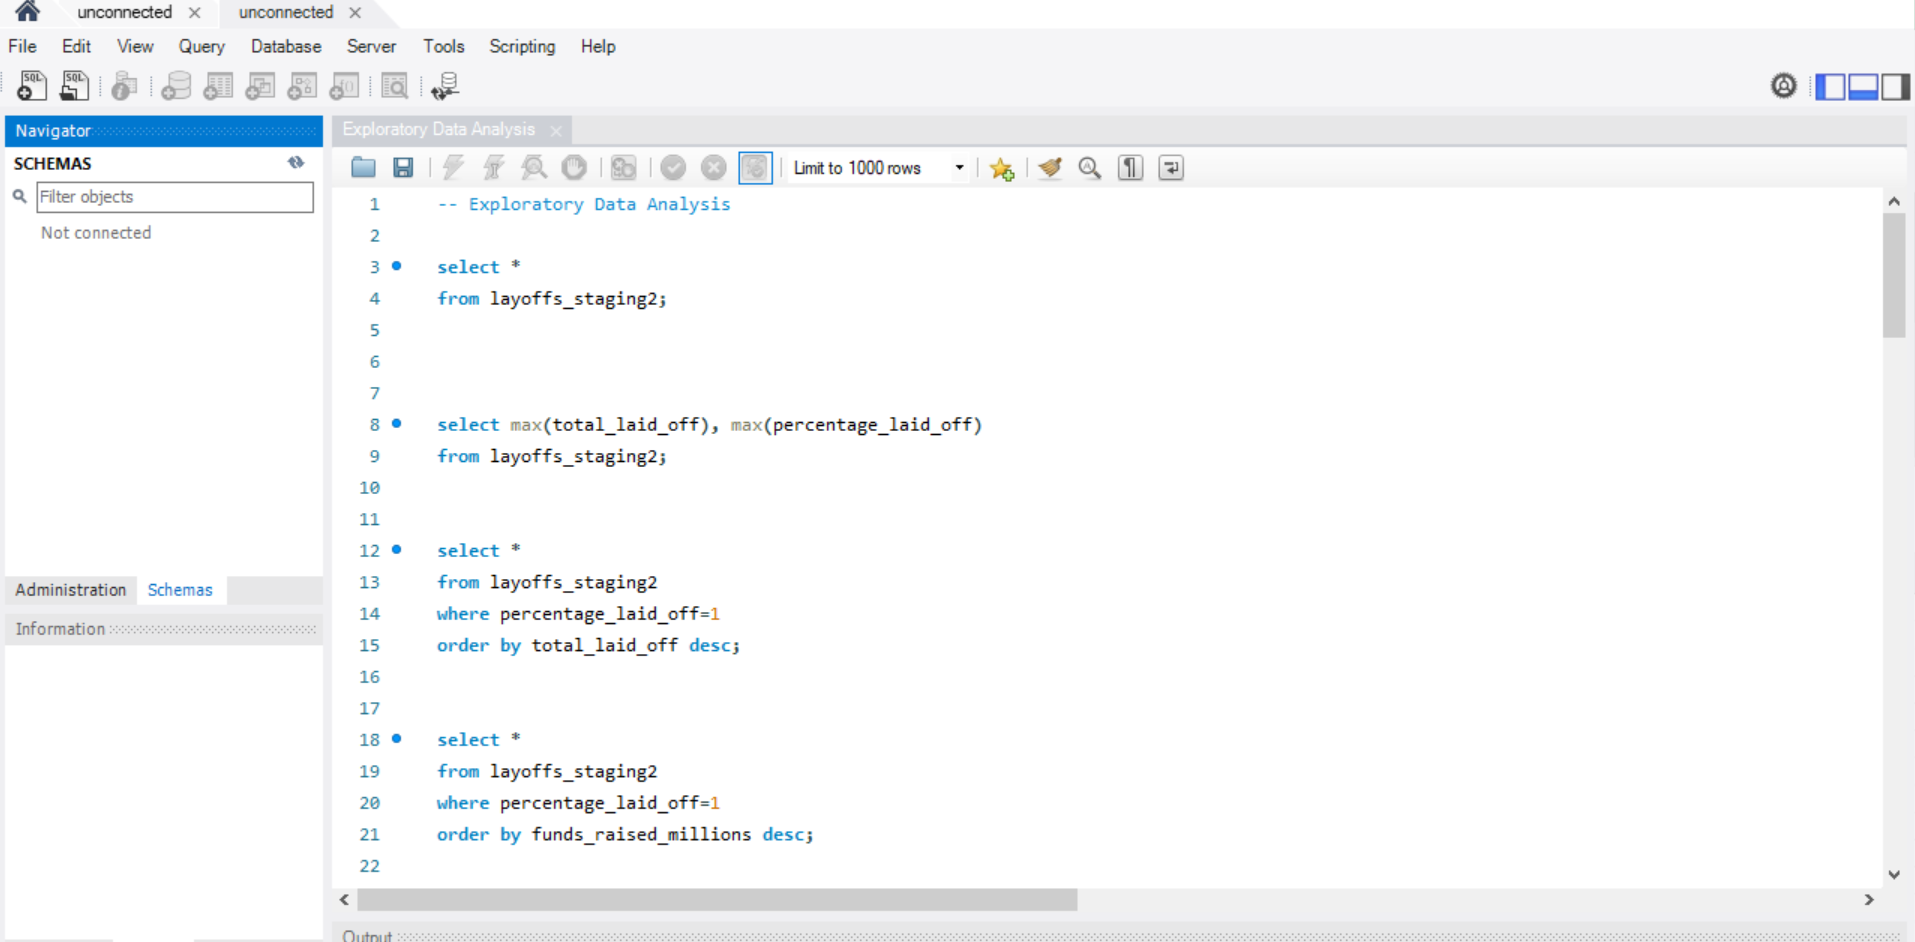
I analyzed a global tech layoffs dataset using SQL, focusing on data cleaning and exploratory analysis to uncover patterns across time, industries, and geographies.
The project involved removing duplicates, standardizing fields, handling missing values, and converting date formats before performing detailed analysis with aggregations, window functions, and CTEs.
Key insights showed that 2022 and 2023 recorded the highest layoffs, with the U.S. leading globally. The Crypto and Consumer industries were among the most affected, and in some cases, companies laid off 100% of their workforce.
View full project on GitHub
About

Hi, I’m Alabi Usman Ayodeji, a first class Biochemistry graduate turned certified Data Analyst. With proficiency in SQL, Excel, Power BI, and Python, I transform raw data into actionable insights that drive business and research outcomes.
Contact
Elements
Text
This is bold and this is strong. This is italic and this is emphasized.
This is superscript text and this is subscript text.
This is underlined and this is code: for (;;) { ... }. Finally, this is a link.
Heading Level 2
Heading Level 3
Heading Level 4
Heading Level 5
Heading Level 6
Blockquote
Fringilla nisl. Donec accumsan interdum nisi, quis tincidunt felis sagittis eget tempus euismod. Vestibulum ante ipsum primis in faucibus vestibulum. Blandit adipiscing eu felis iaculis volutpat ac adipiscing accumsan faucibus. Vestibulum ante ipsum primis in faucibus lorem ipsum dolor sit amet nullam adipiscing eu felis.
Preformatted
i = 0;

while (!deck.isInOrder()) {
    print 'Iteration ' + i;
    deck.shuffle();
    i++;
}

print 'It took ' + i + ' iterations to sort the deck.';
Lists
Unordered
- Dolor pulvinar etiam.
- Sagittis adipiscing.
- Felis enim feugiat.
Alternate
- Dolor pulvinar etiam.
- Sagittis adipiscing.
- Felis enim feugiat.
Ordered
- Dolor pulvinar etiam.
- Etiam vel felis viverra.
- Felis enim feugiat.
- Dolor pulvinar etiam.
- Etiam vel felis lorem.
- Felis enim et feugiat.
Icons
Actions
Table
Default
| Name |
Description |
Price |
| Item One |
Ante turpis integer aliquet porttitor. |
29.99 |
| Item Two |
Vis ac commodo adipiscing arcu aliquet. |
19.99 |
| Item Three |
Morbi faucibus arcu accumsan lorem. |
29.99 |
| Item Four |
Vitae integer tempus condimentum. |
19.99 |
| Item Five |
Ante turpis integer aliquet porttitor. |
29.99 |
|
100.00 |
Alternate
| Name |
Description |
Price |
| Item One |
Ante turpis integer aliquet porttitor. |
29.99 |
| Item Two |
Vis ac commodo adipiscing arcu aliquet. |
19.99 |
| Item Three |
Morbi faucibus arcu accumsan lorem. |
29.99 |
| Item Four |
Vitae integer tempus condimentum. |
19.99 |
| Item Five |
Ante turpis integer aliquet porttitor. |
29.99 |
|
100.00 |